

May 19, 2026
The Knowledge Hub:
Trends, news & views
Welcome to our knowledge sharing hub. Discover the latest industry-leading insights, case studies, COVID-19 and traveller sentiment trends, and hot-off-the-press product news.
Just Landed
KLM achieves 5x redirect uplift with full-funnel brand advertising strategy
“Skyscanner offered a powerful brand platform that drove real impact, helping KLM show up early in the traveller journey. By the time travellers reach comparison and booking, KLM was already front of mind. This intent-led targeting and full-funnel approach, enabled us to drive stronger engagement, capture high-intent demand, and convert it into sustainable growth.”
— KLM team
19 May 2026
Air France drives +204% incremental revenue growth during Jan Peak by scaling performance efficiently
“Skyscanner has become a truly strategic platform for Air France, creating a powerful environment for efficient scale. Alongside strong volume, we are able to capture premium economy and business class audiences, supporting our higher-yield strategy. In a competitive market, being visible at the moment of decision is essential, and our partnership with Skyscanner enables us to capture high-intent demand and convert it into sustainable growth.”
Marouane El Khadir, Media Planning Manager, Air France
Overview
Air France partnered with Skyscanner to scale its marketing investment efficiently, strengthen competitiveness in priority markets and drive sustainable revenue growth. By activating performance placements across 15 key markets, the airline capitalised on Skyscanner’s premium, high-intent environment and set out to secure premium visibility at the precise moment travellers were actively comparing their options.
27 March 2026
Tourism Ireland drives 39x ROAS by rebalancing travel across Ireland’s regions
When you think about flying to Ireland, Dublin is probably the first place that springs to mind. But Tourism Ireland wanted to change that. We worked with their team to help spread visitor traffic beyond the capital, inspiring British travellers to explore more of the country, from Cork, Shannon, Kerry, Knock and Donegal, to the Wild Atlantic Way, the Cliffs of Moher and Ireland’s west coast charm.
3 March 2026

Wait, there’s more. Lots more.


KLM achieves 5x redirect uplift with Skyscanner's full-funnel brand advertising


Air France drives +204% incremental revenue growth during Jan Peak by scaling performance efficiently


Turkish Airlines increases peak season searches by 38% with Skyscanner's brand advertising


Eurowings increases Share of Voice by 32% with Booking Panel Ads

Empowering LHG’s pricing strategy using Skyscanner’s market data insights


Tourism Ireland unlocks 39x ROAS by rebalancing travel across Ireland’s regions

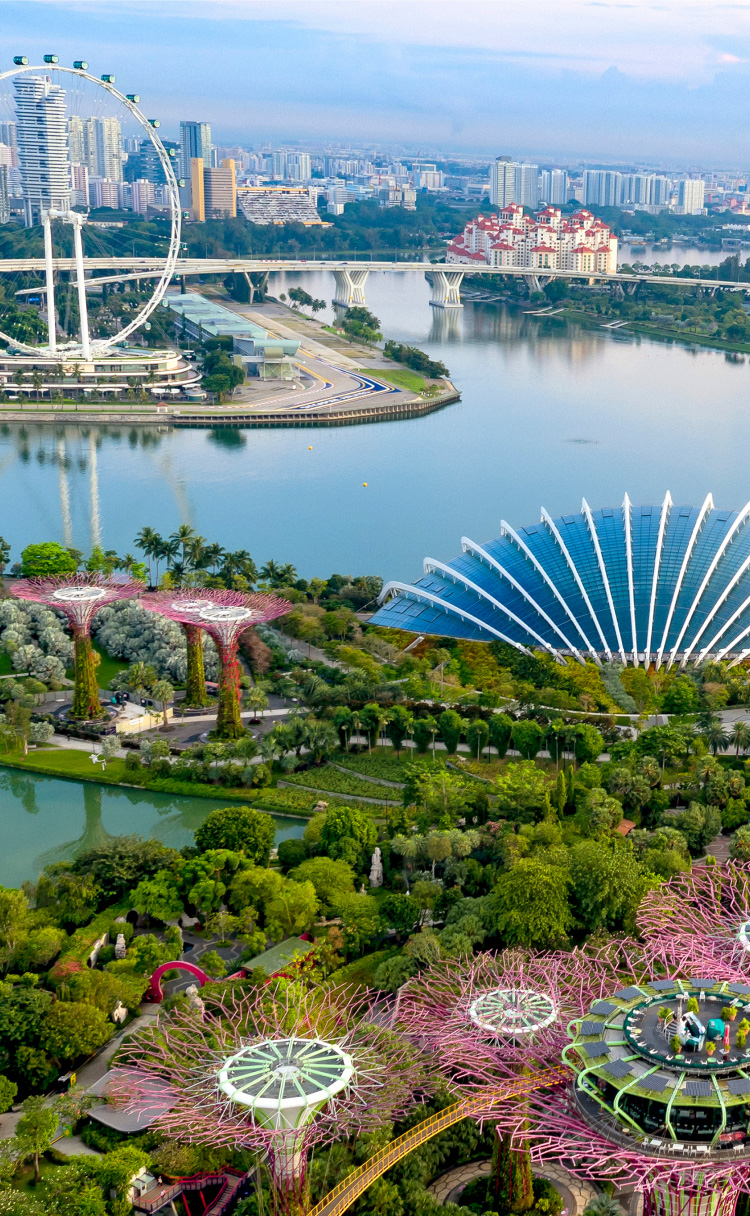
Singapore Tourism Board achieves 78× ROAS with smart targeting and full-funnel storytelling
Empowering the leading airport operator with data insights


Growing Edinburgh Airport’s global route network


London City Airport sparks a 139% surge in winter travel demand with Skyscanner Advertising


.svg)