Track campaign results and uncover traveller insights
The SAM analytics dashboard is designed to give you a clear view of your campaign performance on Skyscanner.
Click 'Advertising > 'Dashboard'
You'll be taken into a view which is pre-filtered to your current campaign. From here you can apply various filters to focus on your desired insights.
Inside analytics dashboard
Track Results
Track Results
Daily Spend
Daily Spend
Daily ROAS
Daily ROAS
User Locations
User Locations
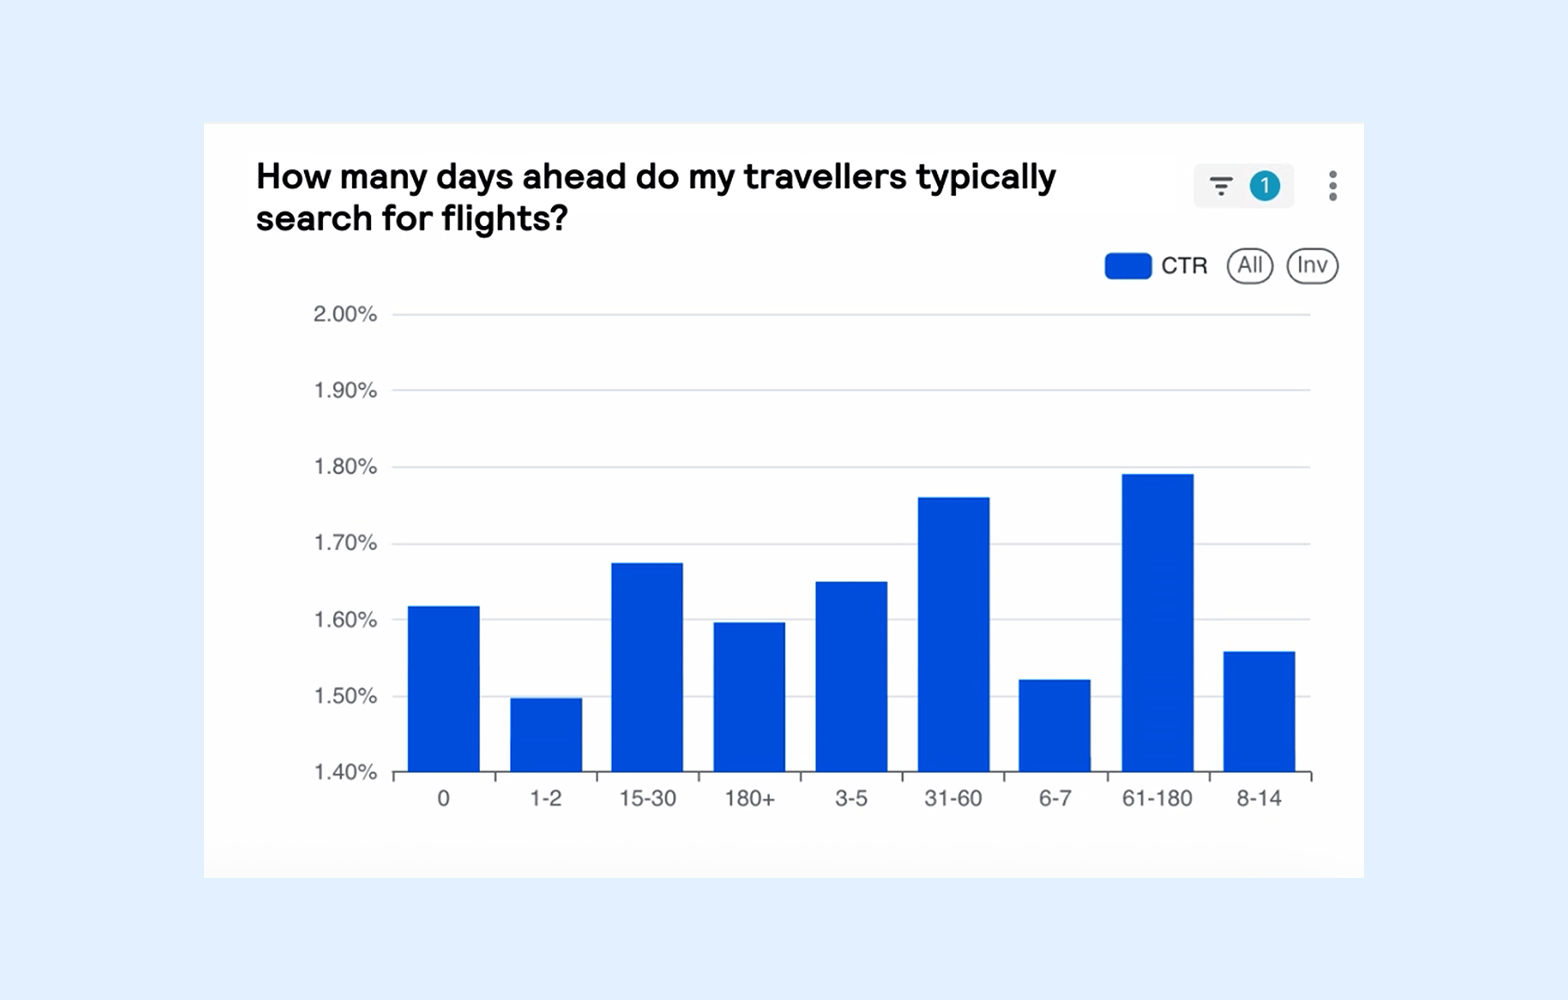
Booking Windows
Booking Windows
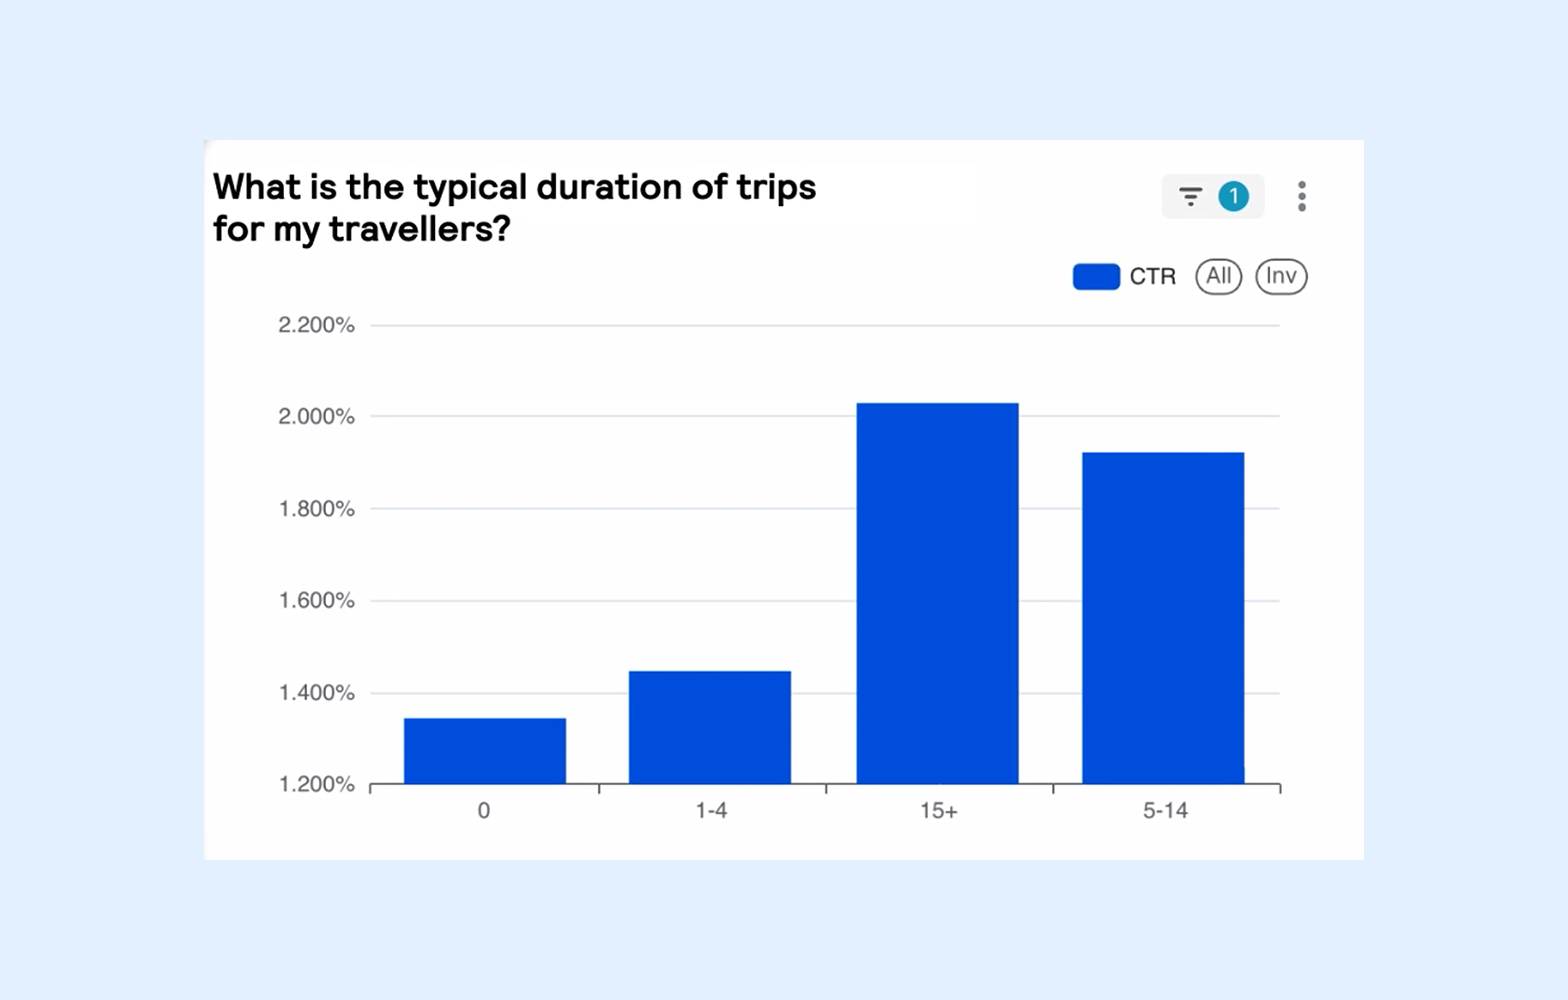
Length of stay
Length of stay
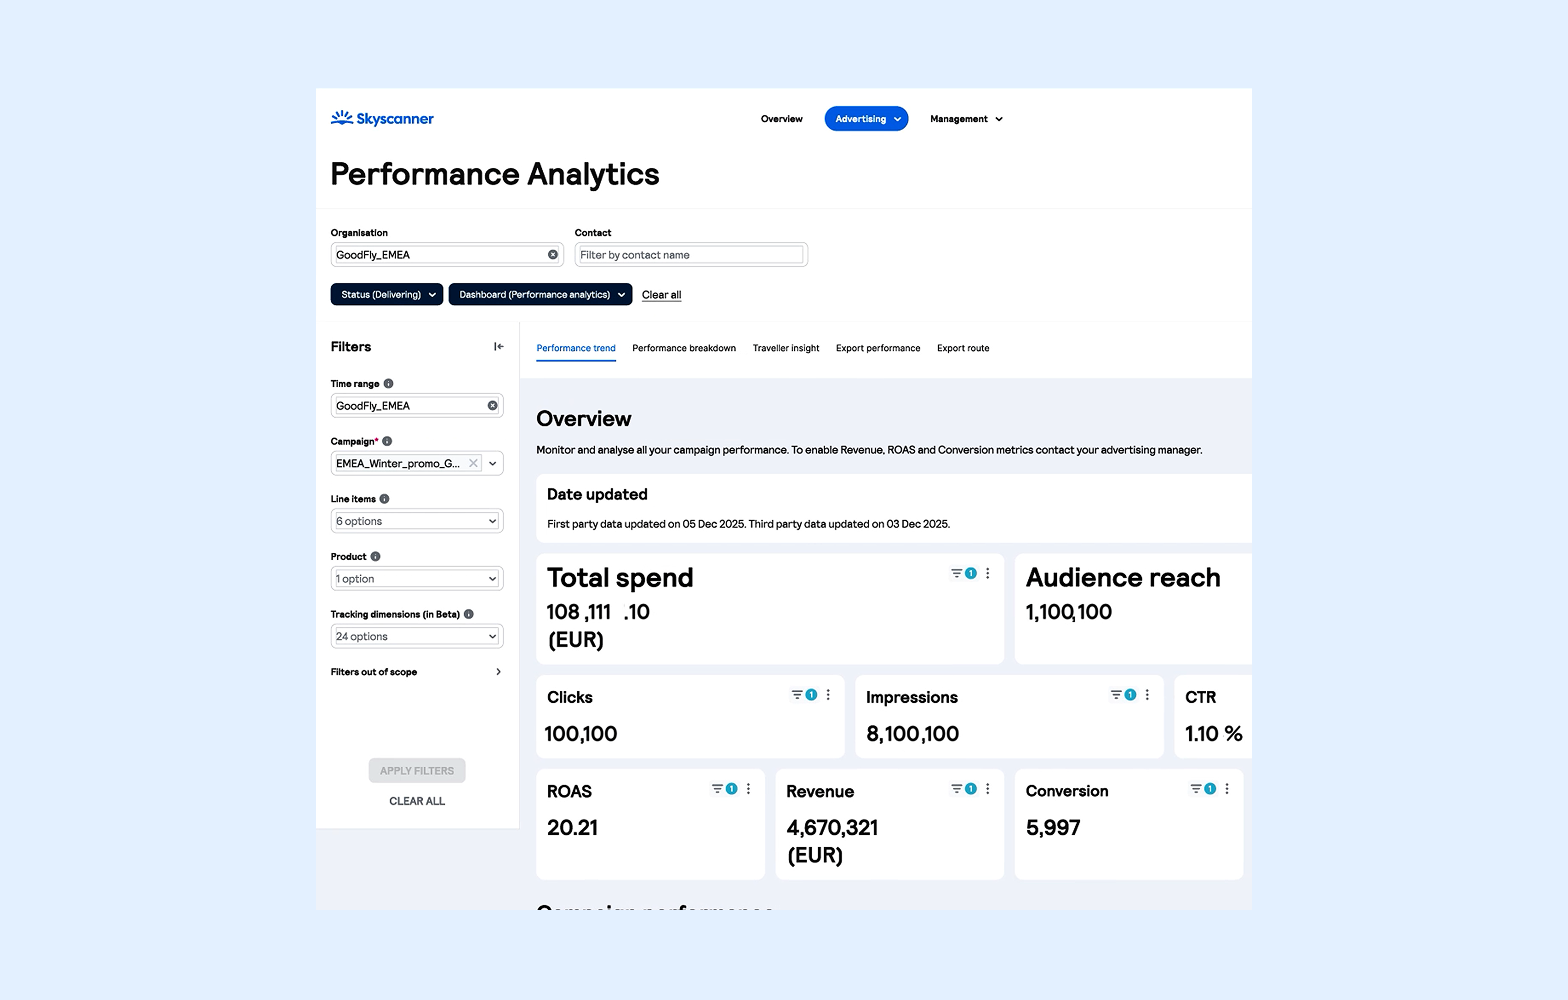
Track Results
Real-time performance
View real-time performance in your dashboard, from spend and clicks to conversions and trends.
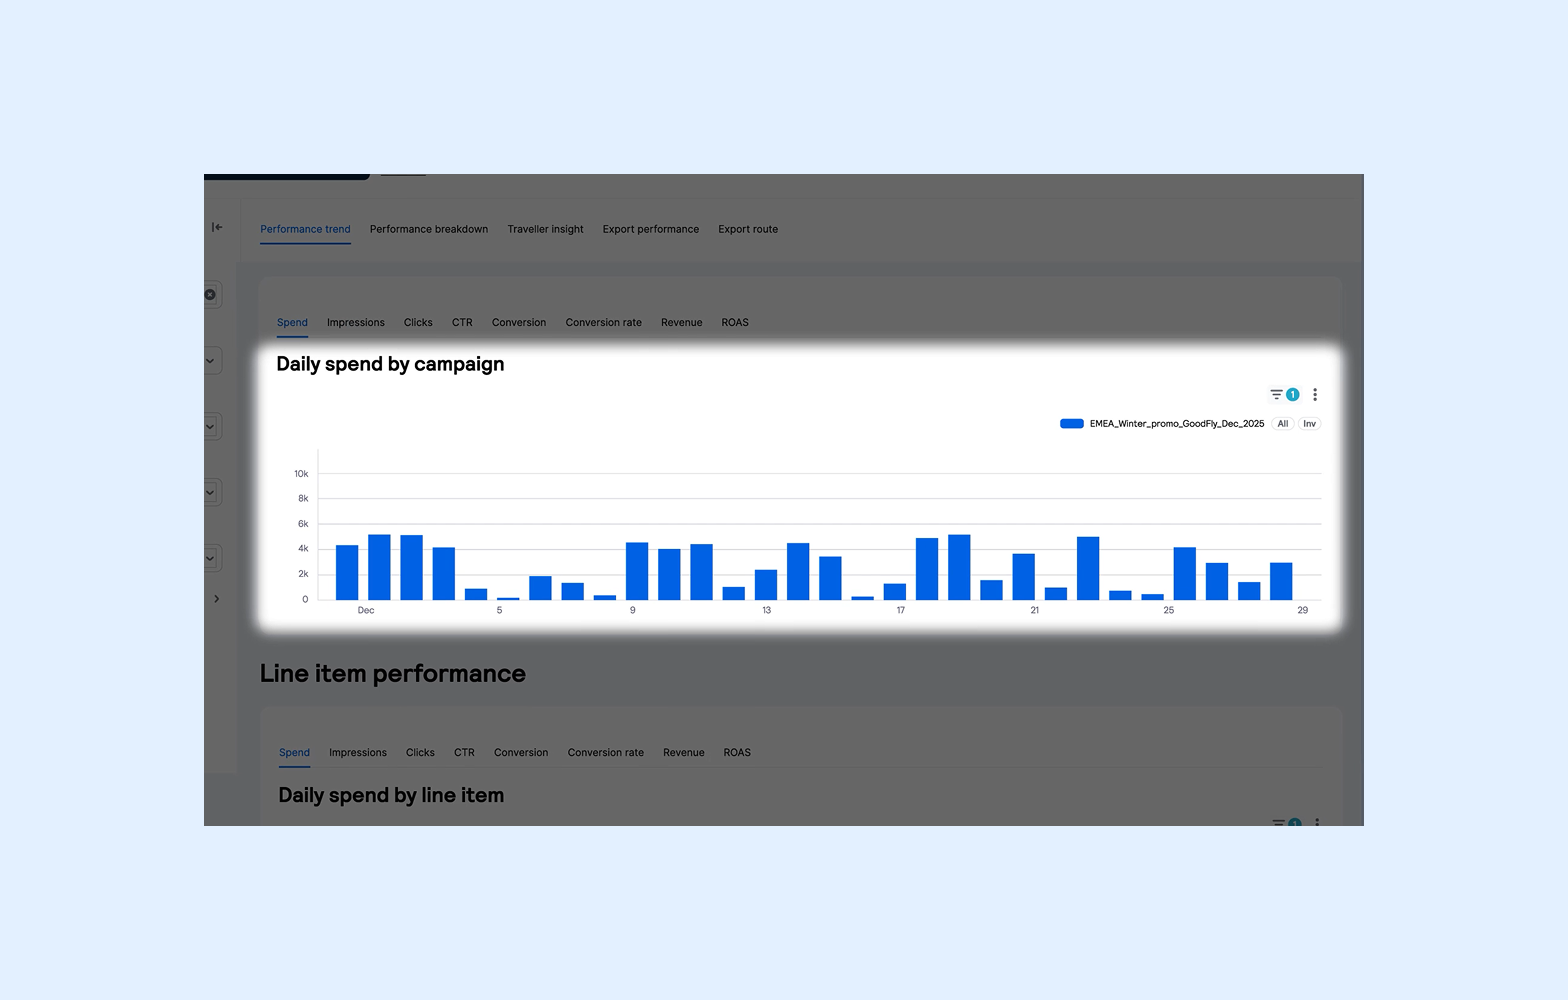
Daily Spend
Monitor your budget
Monitor how your budget is pacing day by day in real time.
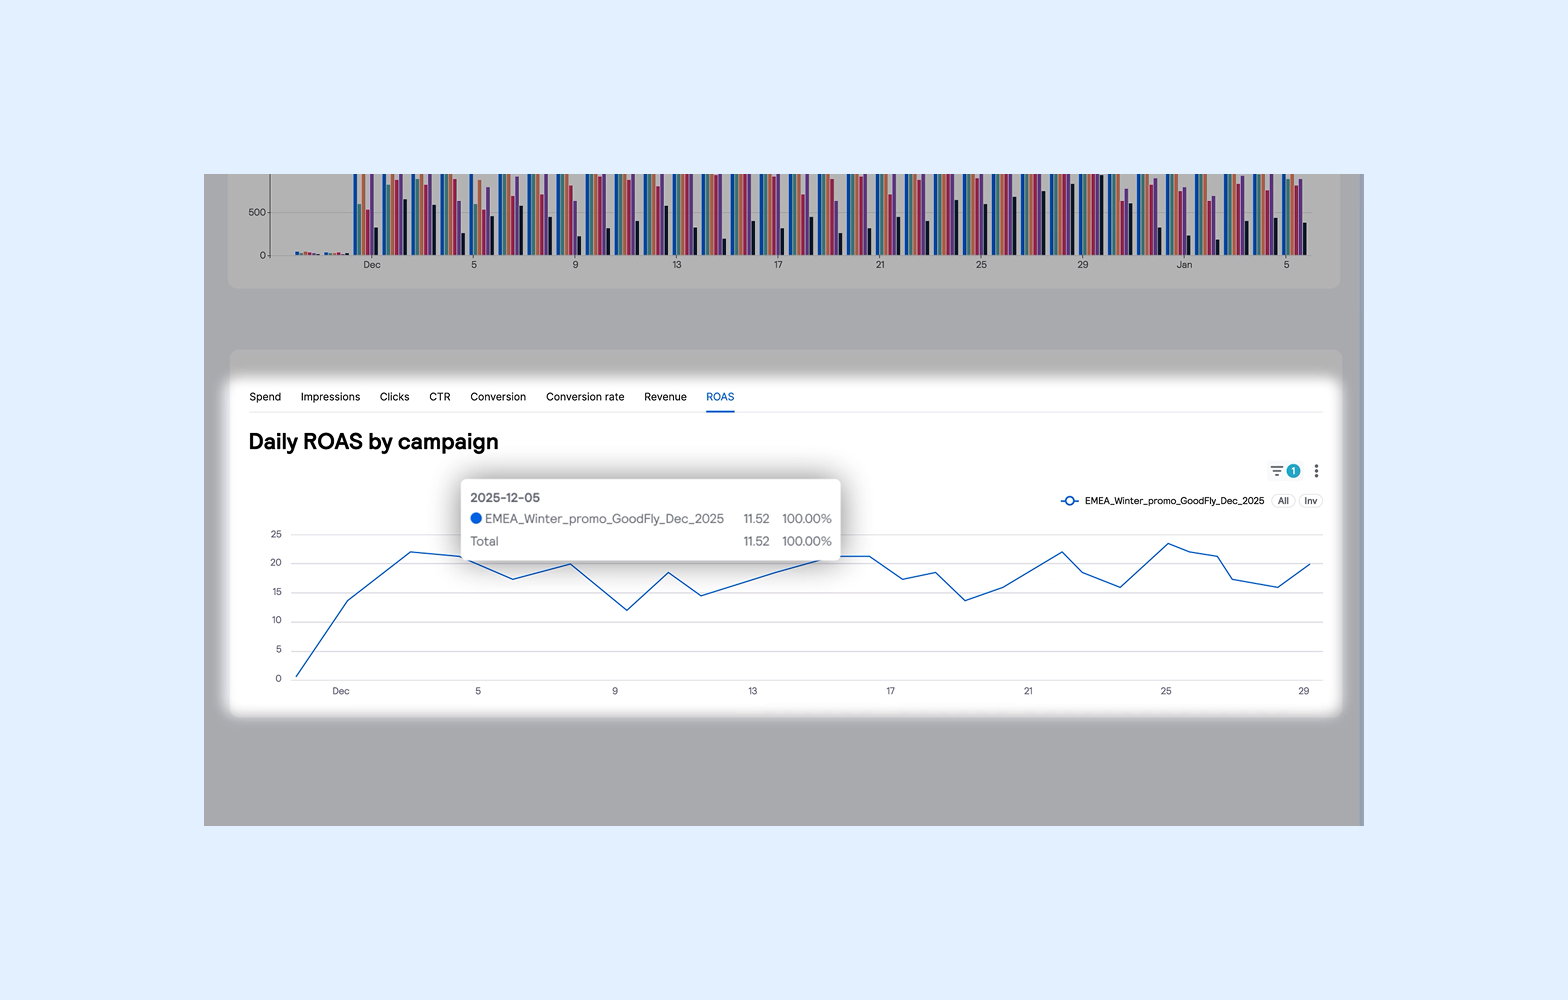
Daily ROAS
Ad spend
Monitor return on ad spend daily to understand campaign efficiency.
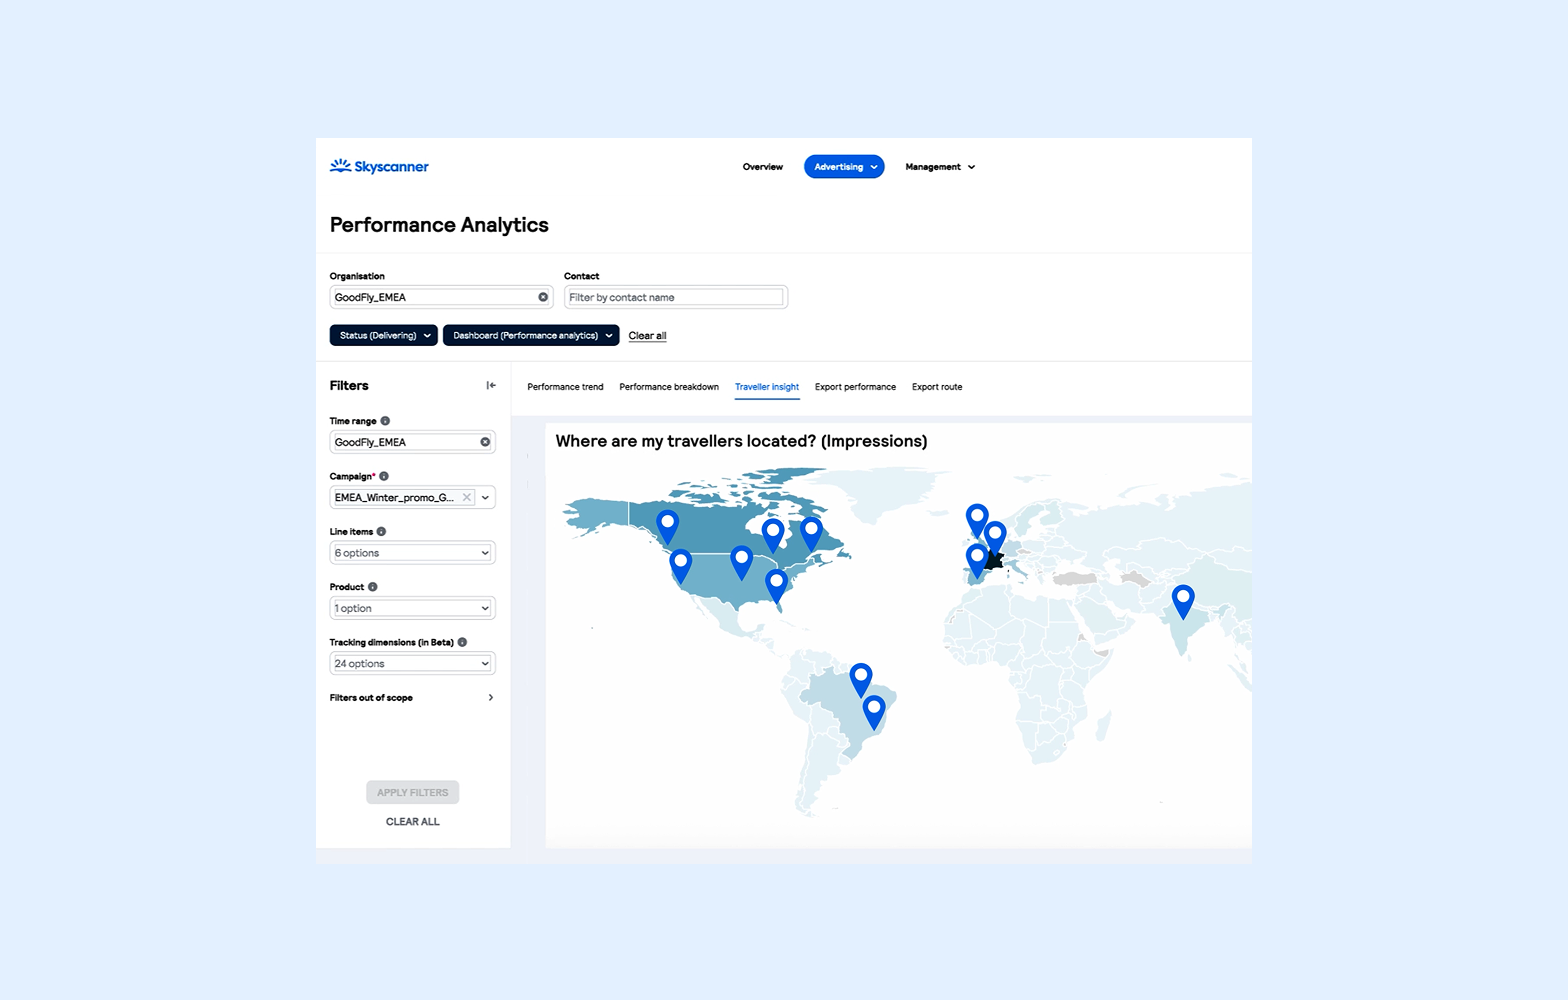
User Locations
Markets
Understand which markets are responding most and where to prioritise spend or expand coverage.
Booking Windows
Flight search
Shows how far in advance travellers search for flights, helping you time campaigns with tactical messaging for short windows and brand or premium storytelling for longer planning periods.
Length of stay
Typical traveller stay
Shows how long travellers typically stay, helping tailor messaging, promote flexibility and frequency for short trips, and premium comfort and long-haul experiences for longer stays.
Explore more
Self-Serve Hub
Discover everything to know about Skyscanner Ads Manager