We've just launched Passenger Leakage, an innovative new solution for Travel Insight Vision, our business intelligence tool for route development, route optimisation and travel trend analysis.
The solution provides an unprecedented look into traveller demand to help Skyscanner’s partners better understand passenger route demand in their catchment area and learn where they’re losing customers to competitors and why.
To tell you more about this new solution and the actionable insights it delivers, we sat down with its product lead, Priya Chhetri.
Hello Priya. So, shall we start with an introduction?
Yes! Hello, I’m Priya, a Principal Product Manager at Skyscanner. I’m responsible for steering the product vision and strategy for our data and intelligence platform that our partners love using to help guide their own strategies and decision-making.
Over the past 15 years, I’ve led multidisciplinary product teams to discover, design, develop and launch enterprise-grade tech solutions in fast-paced environments with high degrees of ambiguity. I get excited by solving complex data problems through artificial intelligence and machine learning, and I’m always happy to roll up my sleeves and get things done.
Can you tell us more about Passenger Leakage and what makes it so innovative for airports and airlines?
Passenger Leakage is the newest addition to Travel Insight Vision’s (TIV) Catchment Analysis module. TIV is our front-end SaaS data tool powered by the forward-looking, near real-time search and booking data of Skyscanner’s 94 million+ monthly users – generated across 295 data points – to provide unique insight into worldwide traveller behaviour and market trends.
For each airport’s specific catchment area, the solution reveals the top routes travellers are searching for and if they're then choosing to fly from somewhere else instead. It’s a really interesting use case in terms of traveller behaviour. Airports can now pinpoint not just where they’re losing customers (passenger leakage) – but why, based on factors such as price competitiveness and day of the week.
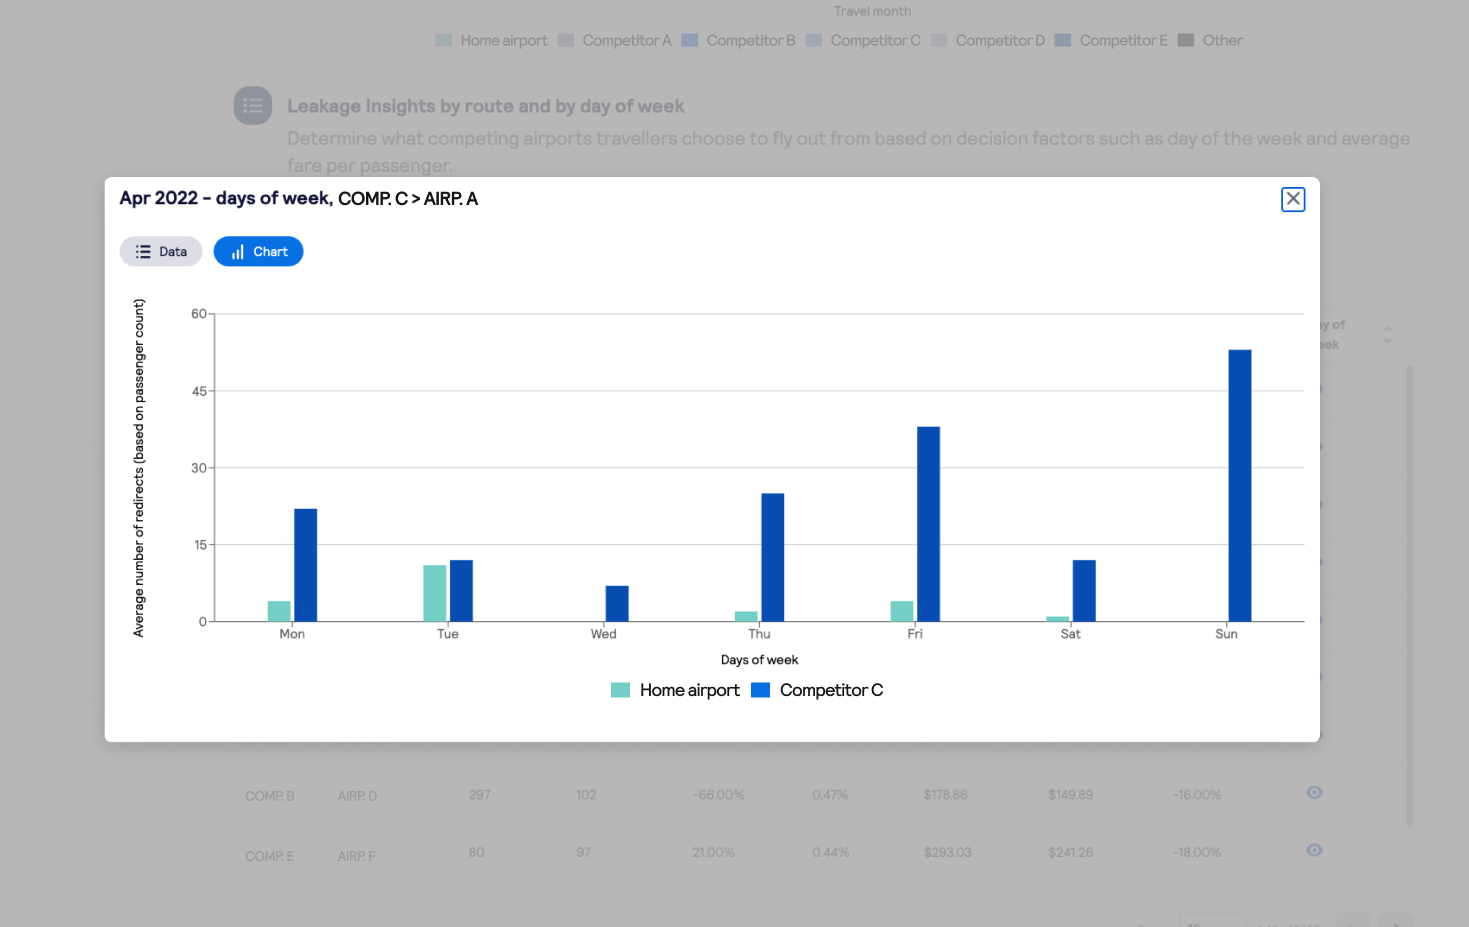
Using Passenger Leakage, an airport partner can see the number of weekly redirect clicks to a destination from their airport compared to a competitor, so they’re able to understand which days of the week they’re losing customers – and by how much.
By providing timely, highly relevant, actionable data intelligence, we’re helping our airport partners make smarter decisions and thrive in today travel’s market.
"We've found Skyscanner's search data to be invaluable in providing forward-looking insights into demand at a route level. This enables us to make strong business cases to airlines for new route development opportunities. We're continually impressed with the dataset’s global scale and segmentation options. It forms a key part of our network planning across Groupe ADP and, importantly, can provide quick, actionable intelligence to help us respond to fast-moving market conditions."
Bertrand Coquant - Deputy Director Aviation Development, Groupe ADP
How was Passenger Leakage developed? Did you work alongside airport partners to build it?
We're constantly iterating, experimenting, beta testing and working in collaboration with our partners to ensure we’re building the best products for them. In short, to make our data and insights even more useful.
For airports, this meant helping them generate actionable insights to better identify leakage and increase passenger connectivity. And part of this meant improving granularity. Thanks to the accuracy and relevance of our geo-location data, partners can now break down catchment even further according to country, region, state, city and airport.
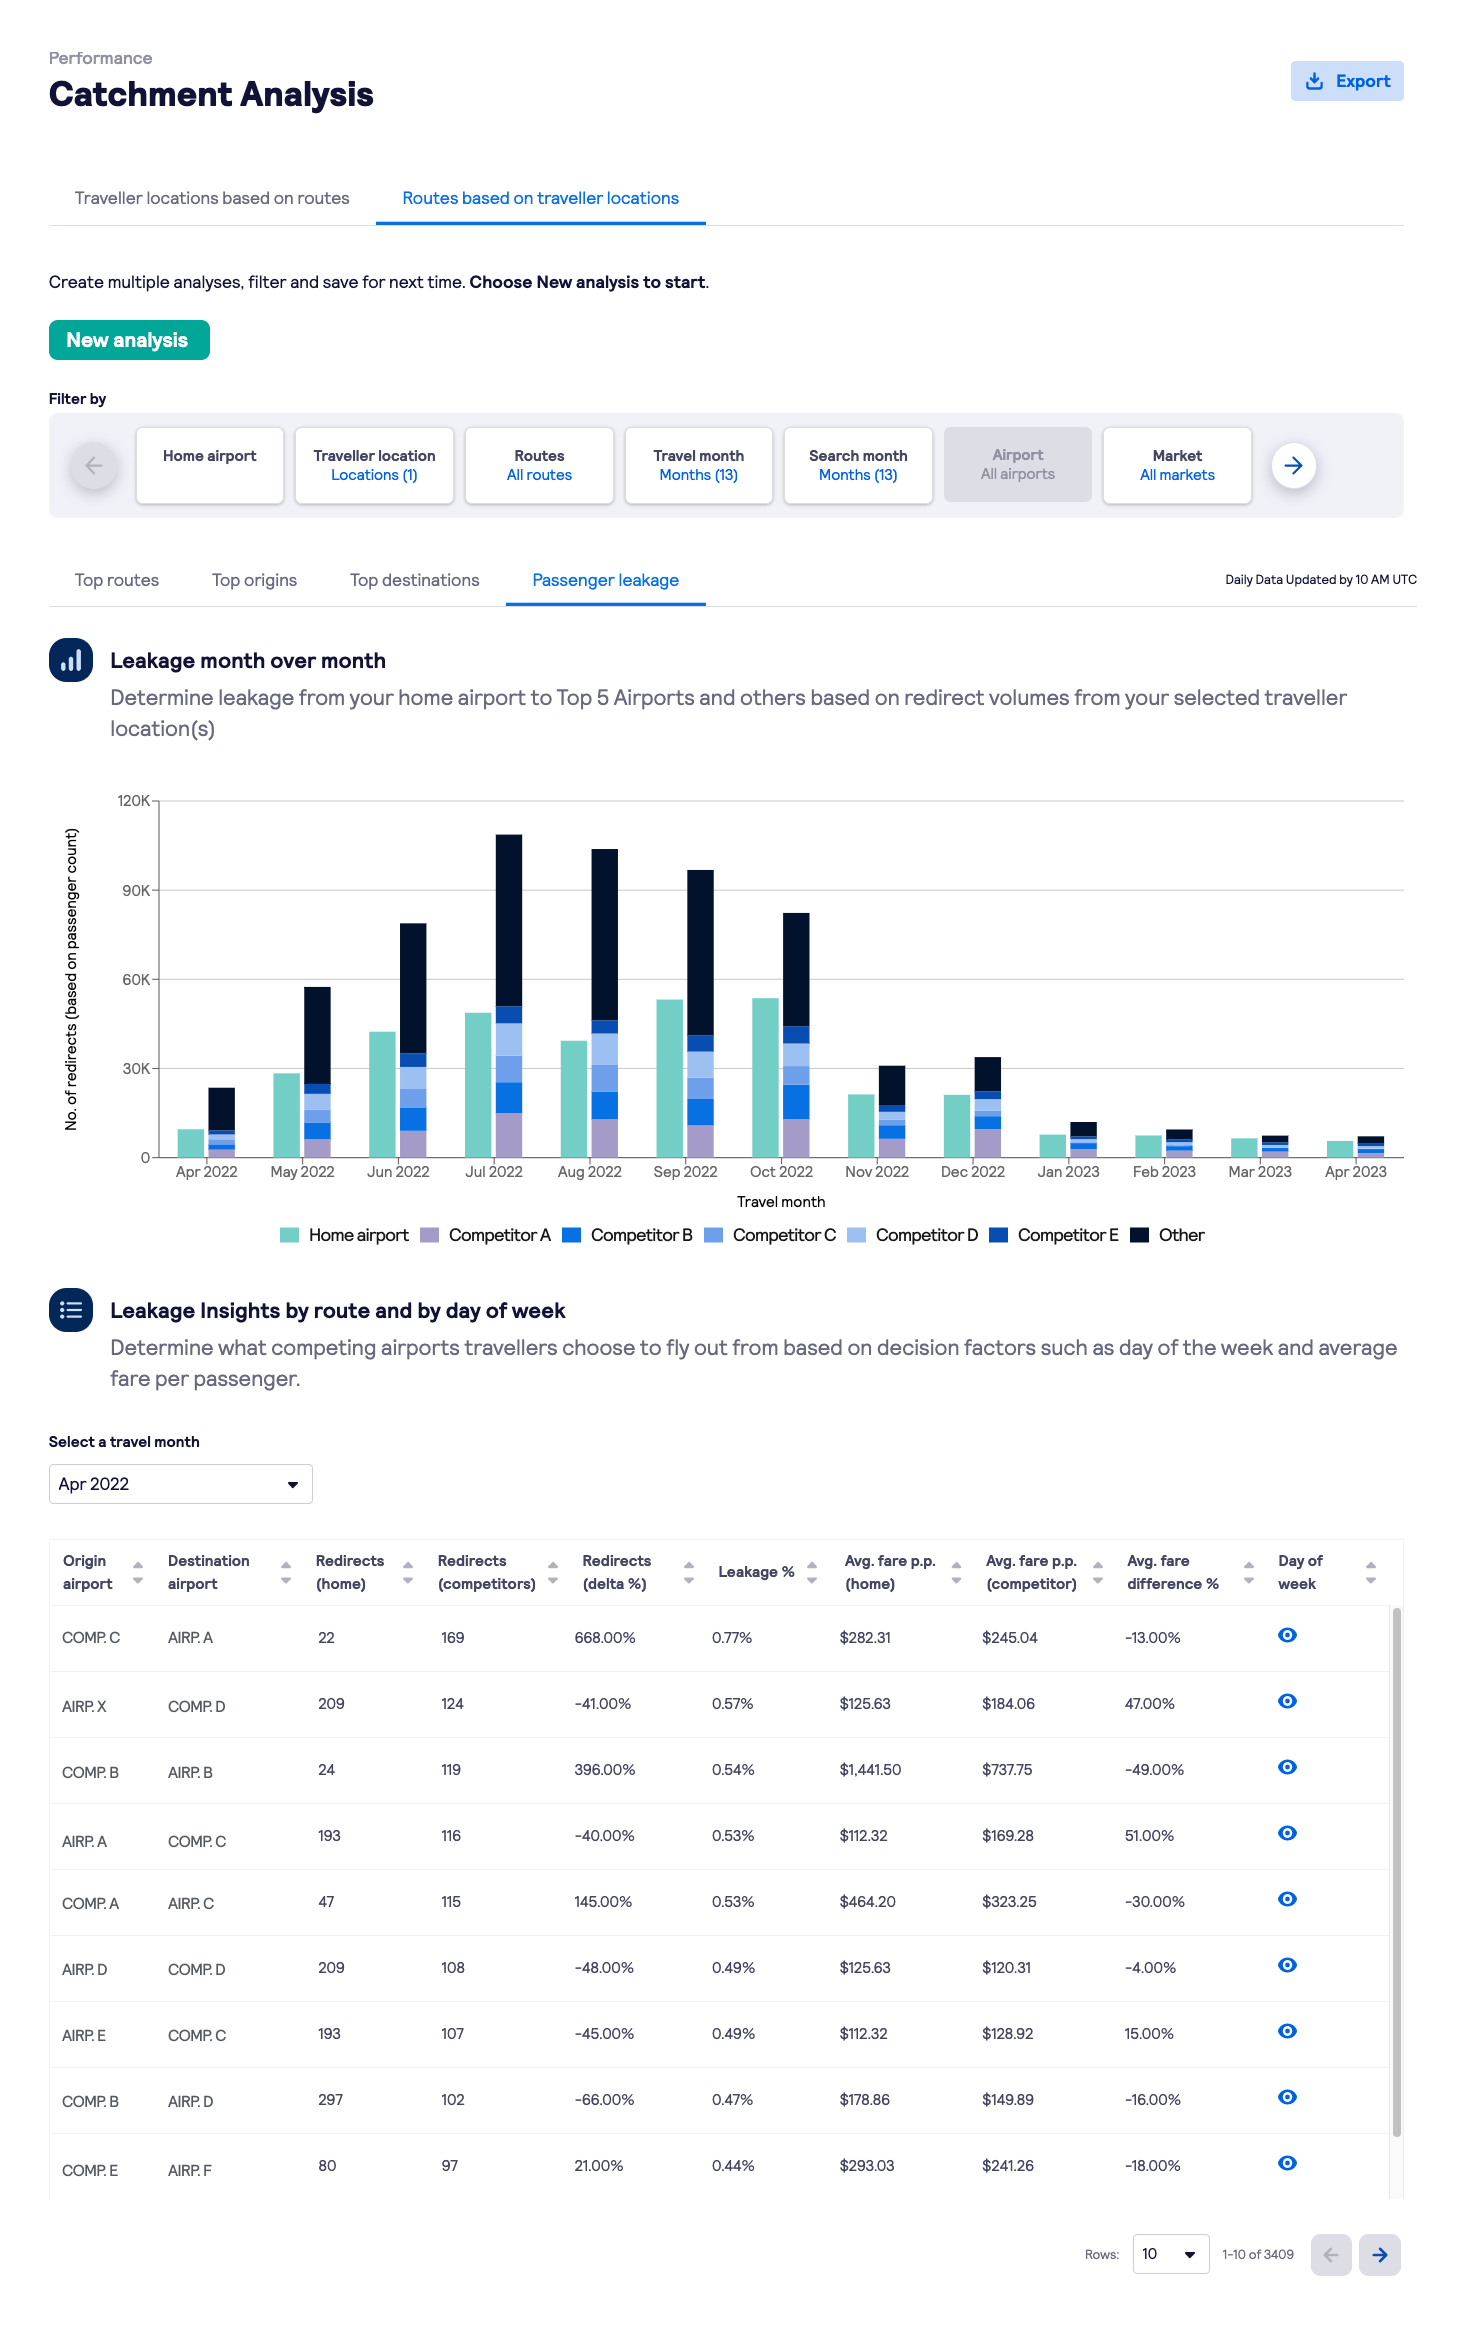
This graph shows the user the top five airports they’re leaking passengers to on a month-by-month basis. The table helps users determine which competing airports travellers choose to fly from based on decision factors such as average fare and day of the week.
How’s it different to other similar products out there and what’s its USP?
Building a solution specifically aimed at airports to help them in the route development space with rich, actionable data insights certainly increased our chances of earning a badge of distinction from our partners.
There are a number of features which make the solution unique in the market. Firstly, our data isn’t derived from census-based sources, so we're not restricted by the size of each census and the percentage of the population included. Our data comes from our worldwide users – 94+ million a month at the moment – an audience no other data provider can access.
Secondly, because we provide access to global data, airports can easily track the top routes and searches of all airports and airlines around the world.
And thirdly, as the data is based on geo-location, it can be segmented to a very granular level for richer insights.
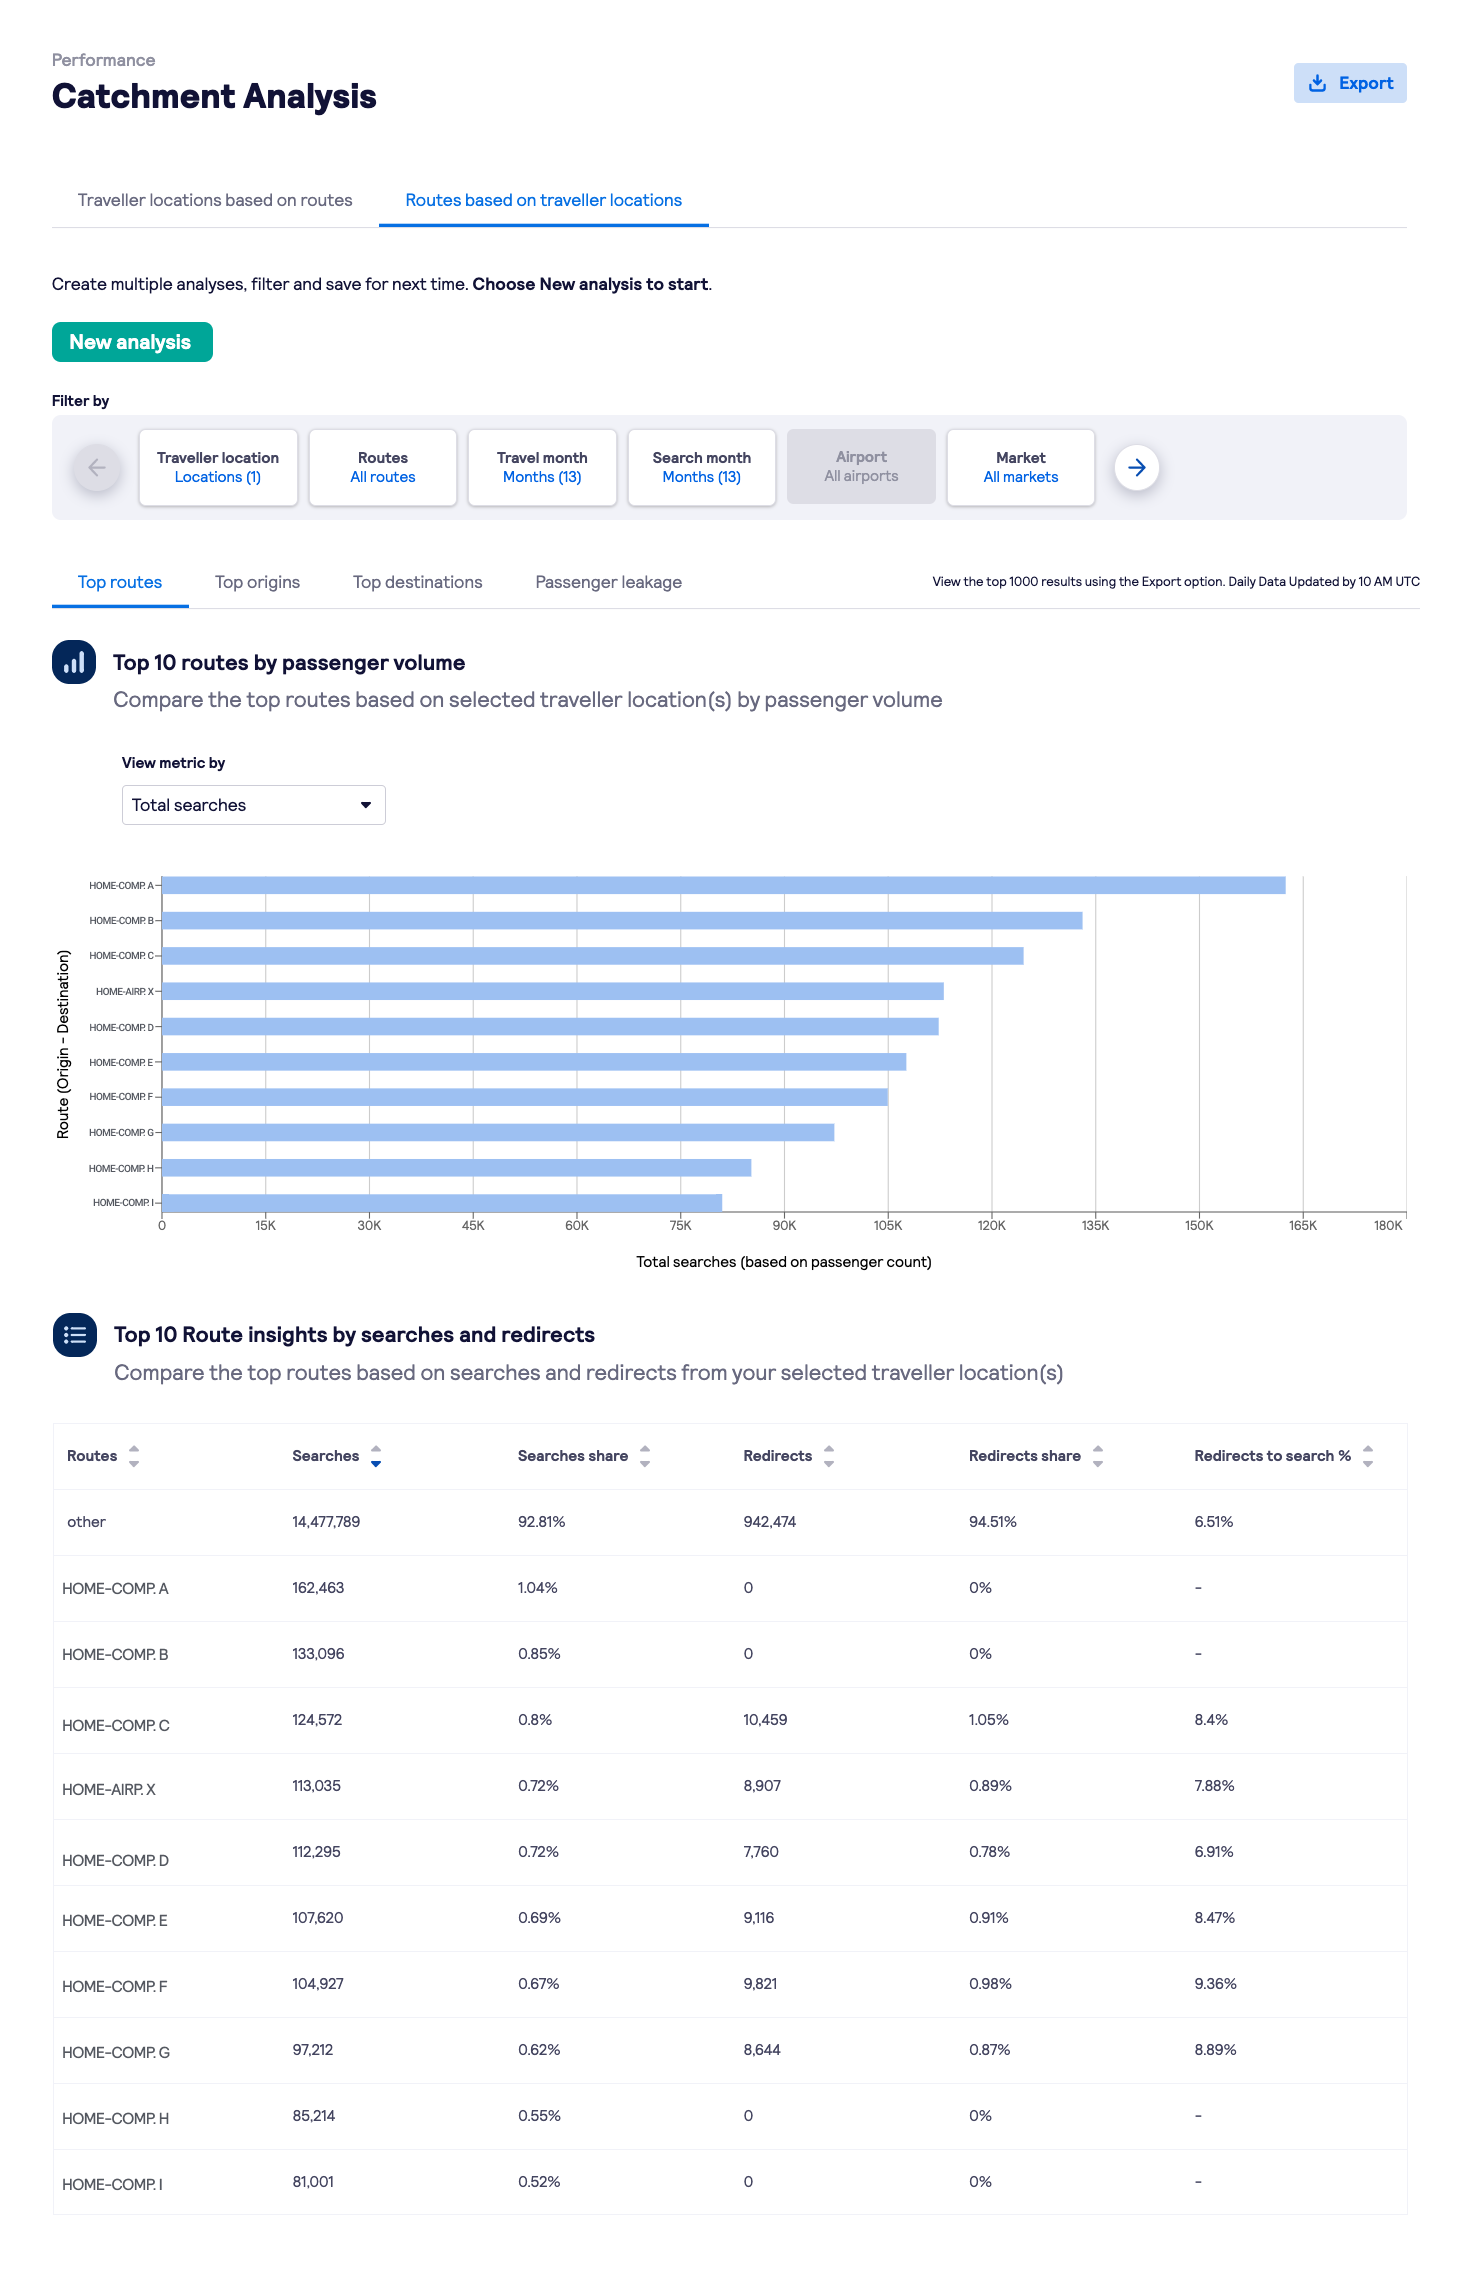
The bar graph in this part of the tool displays the top routes by passenger volume for a selected location. The table underneath shows the top routes for a selected location based on the number of searches and redirects, as well as the redirect to search ratio or click through rate.
What does this launch mean for Travel Insight Vision as a complete solution?
Travel Insight Vision enables our partners to instantly access one of the world’s largest sources of traveller search and booking demand data – via their own personal online portal – to help elevate their knowledge about market and route trends.
With an intuitive interface, it’s easy to break down and analyse data and visualise findings as graphs and tables for the insights needed to make smarter, more profitable decisions.
We designed Travel Insight Vision for smart team collaboration across multiple departments for clean, accessible insights into their own business, competitors and the wider market.
We’ve reached a time when historical data can no longer accurately predict future demand on its own, making Travel Insight Vision more important and useful than ever to help our partners capture travellers’ attention and share of wallet.
Grow your business with Travel Insight
If you’ve not tried Travel Insight Vision before, you can learn more and request a demo right here.
Discover more about how Travel Insight can help your business hit its objectives.
View all articles